There is nothing I like better than a great visualisation. This site sets out a live feed data of the Bitcoin and Ethereum blockchains in action.
I think it is a great tool to help with understanding what is going on with blockchains and the cryptoeconomics behind them, it is actually very straight forward.
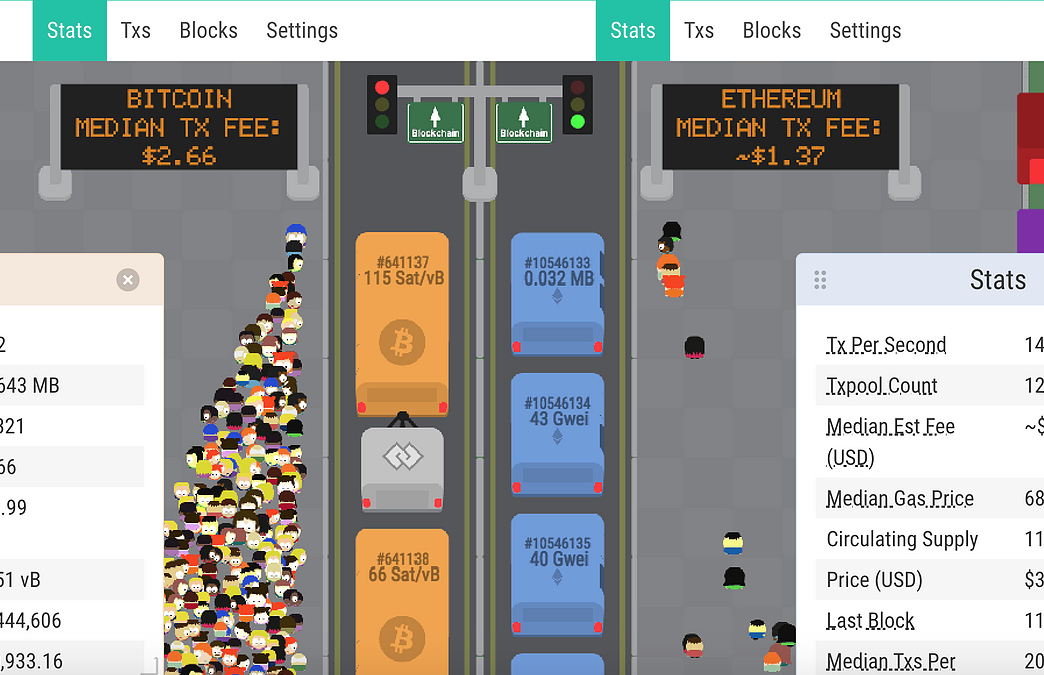
You can see with the visualisation (take the tutorial) that when a new transaction is broadcasted to a cryptocurrency, a person appears and attempts to board a bus.
If the transaction has a high enough fee, they will board the first bus and be ready to be included in the next mined block. If there are too many transactions to be included in the next block, and the transaction didn’t pay a high enough fee, the person will either wait in line or board a different bus. Consecutive buses will appear when there are enough transactions to fill them.
The movement speed of a person represents how high of a fee they paid compared to the current median fee.
The size of a person represents the size of the transaction (Bytes for BTC/BCH, Gas for ETH).